")
Growing faster isn’t about more hustle—it’s about sharper visibility and smarter action. In this article, we break down 5 powerful insights pulled straight from your Weekly Report and each key signal (leads, signups, source breakdown, conversion, call handling, won opportunities, current members). We’ll cover where real opportunity lives, what’s leaking, which sources deserve more budget, how to tighten your sales engine, and why celebrating progress matters.
…Psst, stay tuned for the 12-Month Marketing Calendar coming soon!
8 KEY METRICS IN YOUR WEEKLY REPORT
The metrics in your Weekly Report aren’t just numbers—they’re a map of what’s actually happening in your business. This section breaks down each key signal, why it matters, what it’s hiding if ignored, and how to turn it into action. Think of your Weekly Report as the operating manual for your growth engine: clear attribution, clean data, and fast follow-up mean you can stop guessing and start scaling with confidence.
1. Organic / Google Leads
The ORGANIC / GOOGLE LEADS metric shows inbound interest from SEO/search (without paid spend) + your Google Guarantee program. It measures how well your content and local visibility are attracting qualified traffic. If volume is rising but conversion is flat, improve your website/landing page and/or sales follow-up. We’ll help you double down on high-performing keywords and content.
2. All Leads
The ALL LEADS metric tracks your overall funnel volume for all acquisition channels. It helps you understand Lead Velocity (Week-Over-Week New Lead Growth) — Are leads accelerating, stalling, or decreasing? If leads drop, investigate traffic sources, campaign health, or seasonality. If volume is high but conversions lag, audit lead qualification and sales follow-up.
3. All Signups
The ALL SIGNUPS metric measures your Net New Members, measuring actual success of turning leads into revenue-generating clients. Compare to leads to calculate funnel efficiency. Large gaps = conversion or operational leakage. Use to forecast growth and capacity planning.
4. Lead Source Report
The Lead Source Report tracks lead attribution: which channels are delivering leads, signups, and revenue. Enables ROI (Return on Investment) and performance segmentation. Rank sources by volume, conversion, and value. Reallocate budget/effort away from underperformers and toward high-LTV (Lifetime Value), high-conversion sources. Identify emerging sources worth scaling.
5. Conversion Rate
The Conversion Rate metric measures your team’s efficiency of turning a lead into a signup. This is a core health metric for sales effectiveness and funnel quality. Low rate → diagnose: lead quality, follow-up speed, sales script, objection handling, onboarding friction. High rate with low volume → invest in scaling that lead source.
TARGET: Aim for 30% or greater (by auditing lead quality + follow-up speed + sales process and technique)
6. First Time Incoming Call by Status
The First Time Incoming Call by Status metric tracks responsiveness on the phones (highest-intent touch). Missed or slow answered high-intent calls = lost opportunity. Train/re-balance coverage, implement fallback texts, flag persistent status mismatches (e.g. calls not progressing to next stage).
7. Current Members
The Current Member metric tracks your active client base till date. It’s your total active member count. This is the denominator for retention, engagement, and revenue forecasting. It allows you to track growth and attrition. If active members plateau or dip, trigger re-engagement campaigns, implement member nurture threads, member satisfaction checks, or cohort analysis to find early churn drivers.
KEEP IN MIND: It’s always better to be proactive, rather than reactive. Good thing you have ENB on your team, giving you access to over 20+ years of combined knowledge, expertise, and assets—not only in marketing, but sales, customer experience, operations and biz dev. Our team is already implementing targeted nurture threads and data-driven reactivation campaigns for you. As we gather more and more data from your market, and Alloy as a whole, we’ll continue to evolve your strategies into a well-oiled machine that generates members who pay, stay & refer.
8. WON Opportunities by Source
The WON Opportunities by Source metric combines attribution with closed revenue—showing which of your current acquisition paths are actually converting to paid wins. This metric helps you validate source quality, not by leads, but closed sales.

5 POWERFUL INSIGHTS TO GROW FASTER
Great, so now you have these metrics automatically hitting your inbox each week… But what do you do with it?
There are numerous actions you can take to continually improve your sales process and marketing strategy. We’ve outlined 5 powerful insights you can generate from your Weekly Report and how to act upon them.
✅ 1. Keep Your Operations Sharp
- Are Opportunities being updated and handled accordingly?
So What: Opportunity / Signup mismatches, mis-tagged wins, or stale leads hide real performance.
Do This: Audit your Opportunities processes:
- Are Opportunities being marked WON consistently? All Secured/Active Opportunities should be marked WON, no other Opportunity stages should have the WON status.
- Do Opportunities contain the sales value so revenue tracks cleanly? This turns raw activity into real economic visibility. It creates Pipeline Revenue Forecasting so you can roll up open opportunities into a dollar-value and project future revenue potential.
- Are incoming calls being answered? This helps spot training or coverage issues.
So What: Missed calls = lost high-intent prospects (which is lost revenue)
Do This: Set a goal with your team to achieve 0 missed calls per week.
This may require auditing call coverage blocks (why are calls being missed?), routing incoming calls to more than one person, and/or leveraging AI to answer calls missed by your team.
✅ 2. Increase Lead Clarity & Accountability
- Are all leads on my team’s radar and being quickly addressed?
So What: If your lead data is fuzzy, opportunities slip, follow-up lags, and you’re slow to expose gaps.
Do This:
- Flag leads with no outreach and assign follow-up to owners
- Tag inevitable spam/fake leads as “spam” so metrics reflect real opportunities.
- Monitor if your marketing efforts are scaling as expected
- Are you pacing as expected this month?
- What pacing goals should you set for next month based on this month’s performance?
✅ 3. Improve Sales Efficiency
- Benchmark sales performance: 30% or greater conversion rate is the starting goal
So What: A low conversion rate means you’re leaking revenue, and lack sustainable growth.
Do This: Low conversion is either lead quality, speed, or process friction. To improve your conversion rate and generate greater revenue, audit your lead quality, follow-up speed and sales technique, and Opportunity management. Look at why leads drop off, where leads drop off, and how fast and often your team reach out.
- Audit where leads drop off: which stage, source, and timing
- Evaluate lead quality versus conversion—attracting the right prospects?
- Measure and speed up first outreach; slow follow-up kills momentum
- Review sales technique (follow-up, objection handling, rapport building)
- Review Opportunity hygiene (stages, values, updates)
- Stop overcalling cold leads; excessive daily calls hurt deliverability and annoy prospects
*Side Note: If you’re calling the same lead every day (we’ve even seen some studios calling 4x per day 🫣), you’re not only damaging your caller reputation with phone carriers, you’re killing your sales.
The best phone cadence (for outbound calls) is 1/2/3/5/7/10 days: Call the lead immediately, 2 days later, 3 days later, 5 days later, 7 days later, 10 days later, then pause. Let your lead nurture drip work its magic. After 30-ish days, deploy a Soft Reactivation: a warm, non-pushy check-in that assumes interest rather than pressures it.
✅ 4. Scale Smarter with Source Intelligence
- Am I allocating my resources toward the best lead sources?
So What: Not all traffic is created equal—don’t waste precious time and money on traffic that doesn’t convert
Do This:
- Double-down on sources closing the most and converting best
- Compare your Cost-Per-Acquisition (CPA) to Lifetime Value (LTV)
- Kill or fix underperformers leaking time and money
- Identify your best lead sources:
- What source is closing the greatest number of leads?
- What source brings the highest quality leads? You’re looking for the best conversion % and greatest lifetime value.
- What source offers my best ROI (highest profit per $1 spent)?
✅ 5. Celebrate WINS!
- What you measure, improves—especially when you celebrate it.
- Celebrate new Current Member milestones
- Celebrate signup growth this month
- Celebrate Conversion Rate increases
- Celebrate 0 missed calls
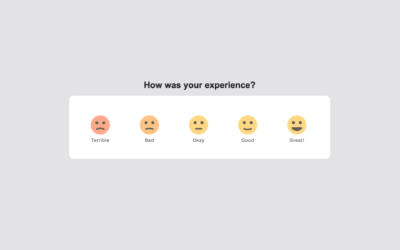
- Celebrate positive member feedback
- Celebrate positive reviews

ARE YOU SPENDING TOO MUCH ON LEADS?
By comparing your Cost per Acquisition (CPA) to Lifetime Value (LTV) you can tell whether what you’re spending to get a new member actually makes sense over the long run.
For a step-by-step guide to calculate these metrics, read this article:
ARE YOU SPENDING TOO MUCH ON LEADS? STEP-BY-STEP GUIDE